Built with Claude · Anthropic Hackathon 2026

PRISMA

See what happens before it happens.

Upload your spreadsheet. Test every decision before you commit.

Make Your First Decision

Free. No signup. Simulations run in your browser.

“Should I hire two more drivers before Q3?”

Hire in Q2 +€3,100/mo
Raise base pay +€1,200/mo
Do nothing −€4,800 by Q4
Hire in Q2
Raise pay
Do nothing

“Which zones are bleeding delivery time?”

Reassign Zone C −18 min avg
Add evening shift −12 min avg
Split Zone A −7 min avg

“Can we cut overtime without losing SLA?”

Cap at 10h/week 89% SLA
Rotate weekends 94% SLA
No change SLA drops to 81%

1,000 scenarios · computed in real-time

Works for any spreadsheet data.

Your data. 1,000 futures. One clear answer.

Your data
1,000 futures
Your answer

Chat with your data.

Probability. Risk. Recommendation. In seconds.

"What happens if I cut the fleet from 40 to 35 drivers?" 72% SLA holds · 28% Mon/Thu risk · €4,200/mo saved · Cut to 37 first.

What your spreadsheet can’t show you.

Patterns
€47K in overtime
PRISMA shows 60% came from 4 drivers on Tue/Thu shifts — and it started 6 weeks ago.
Possibilities
1,000 futures
Your spreadsheet has last month’s numbers. PRISMA runs 1,000 futures and shows which decisions survive the worst case.
Risks
SLA at 94%
PRISMA flags that 3 top drivers show burnout signals — if any one leaves, SLA drops to 86% within 2 weeks.

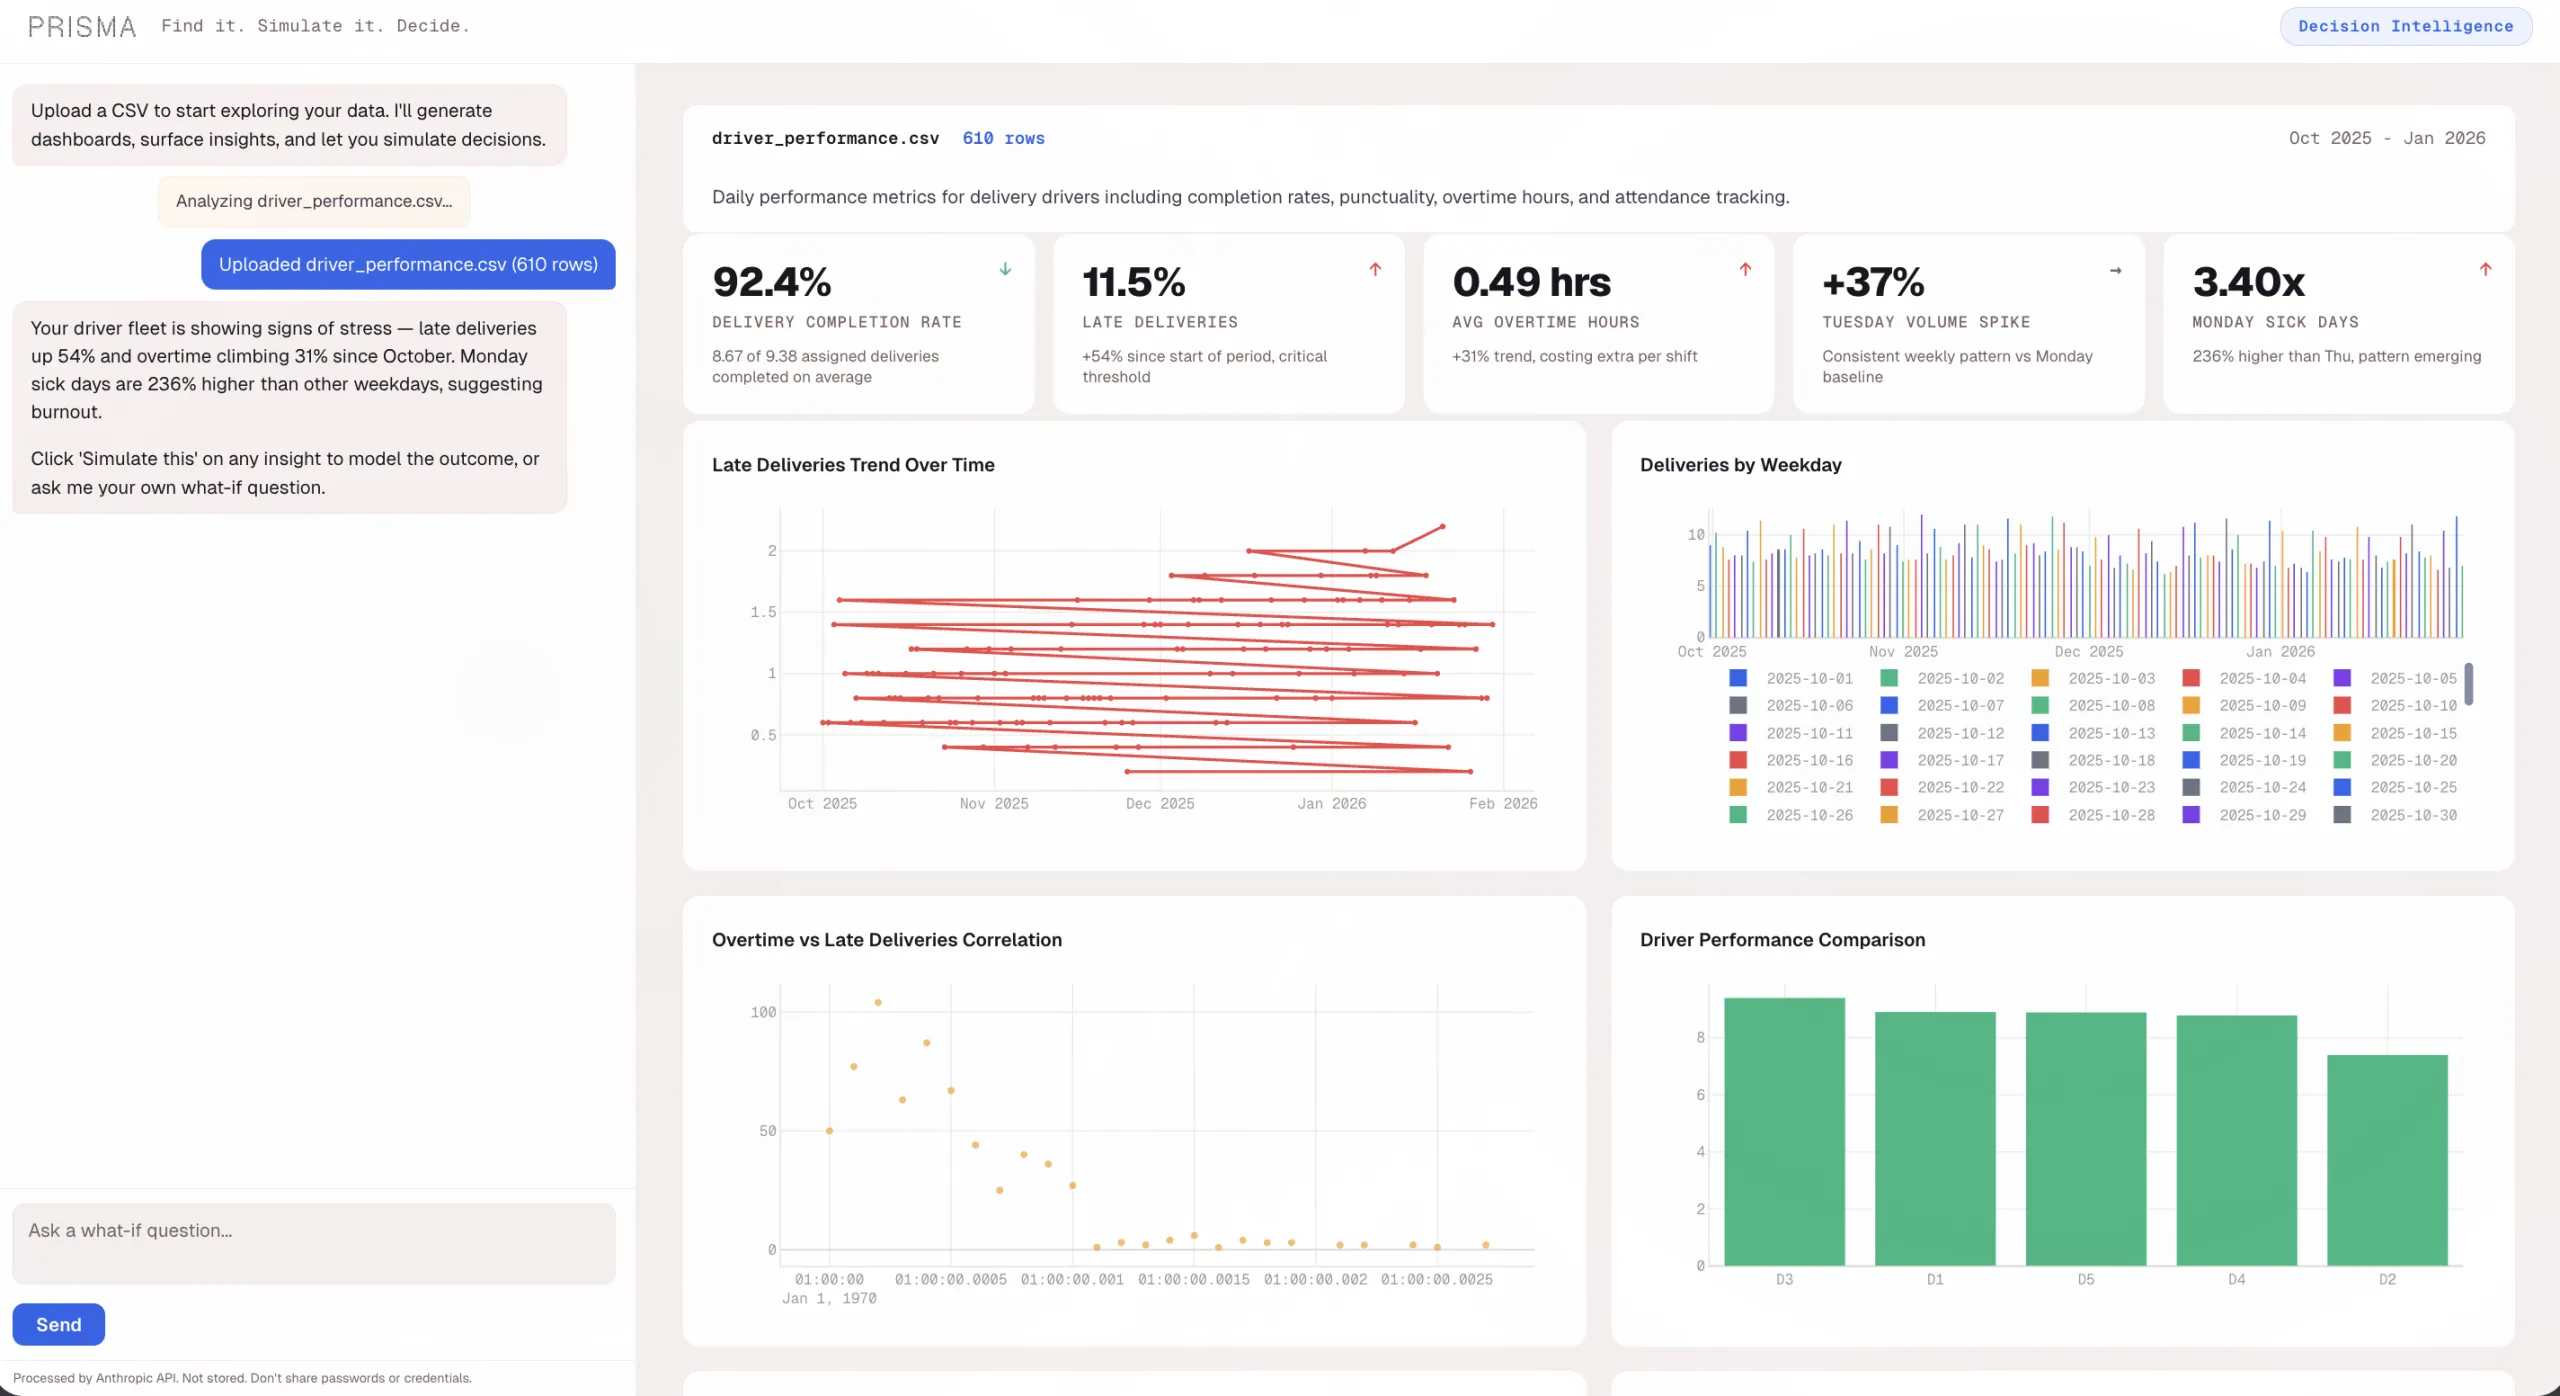
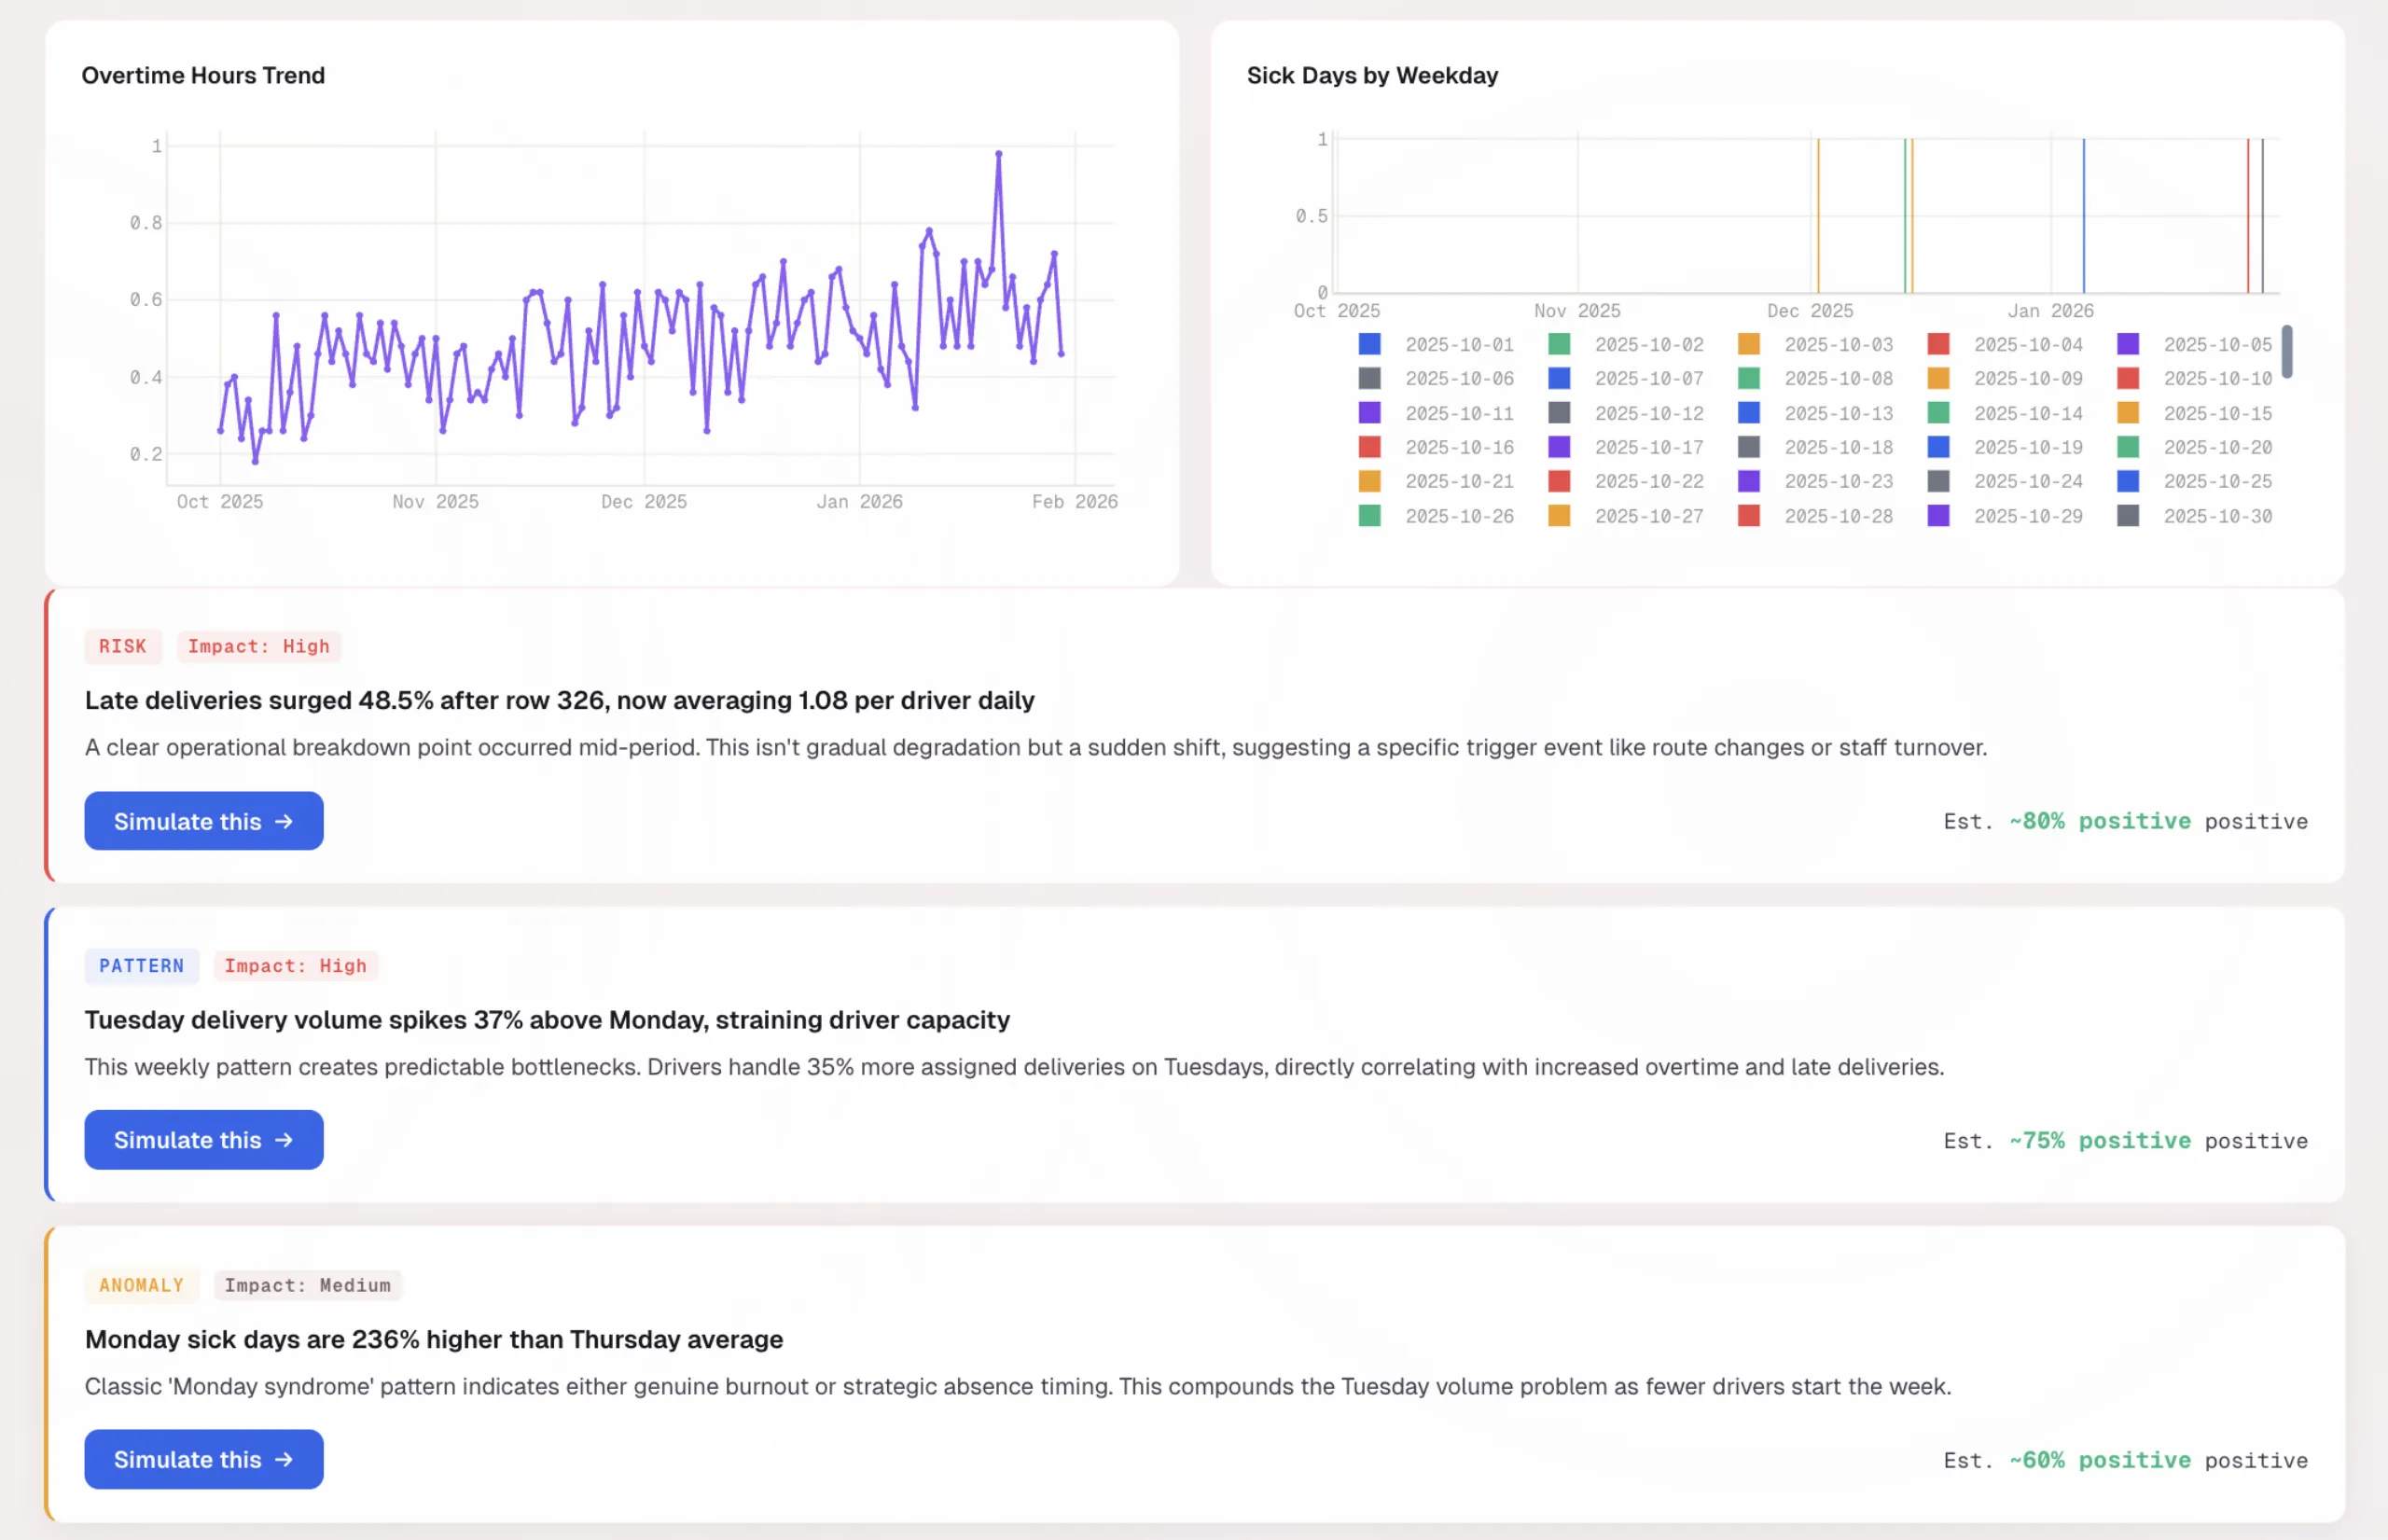
Live product. Real data. Actual simulation output.

Built for ops managers who make high-stakes calls on bad data. And for data scientists who want the same rigor in 60 seconds instead of 60 minutes.

Every decision is a bet.

See the odds first.

Free. No signup. Just answers.

Make Your First Decision
Muzaffer Hizel From warehouse floors to HQ boardrooms — scaled operations from single-city launches to multi-region P&Ls across Big Tech and unicorn startups (Seed to Series C). Built the dashboards, designed the processes, made the calls. Now building the tool I wished I had. Built with Claude (Opus 4.6) · Anthropic Hackathon 2026